- Edition
- November 2026
- Checked
- 20 November 2026
- Charts
- Two
- Formats
- PDF and PNG
Two charts: one for search engines, one for AI
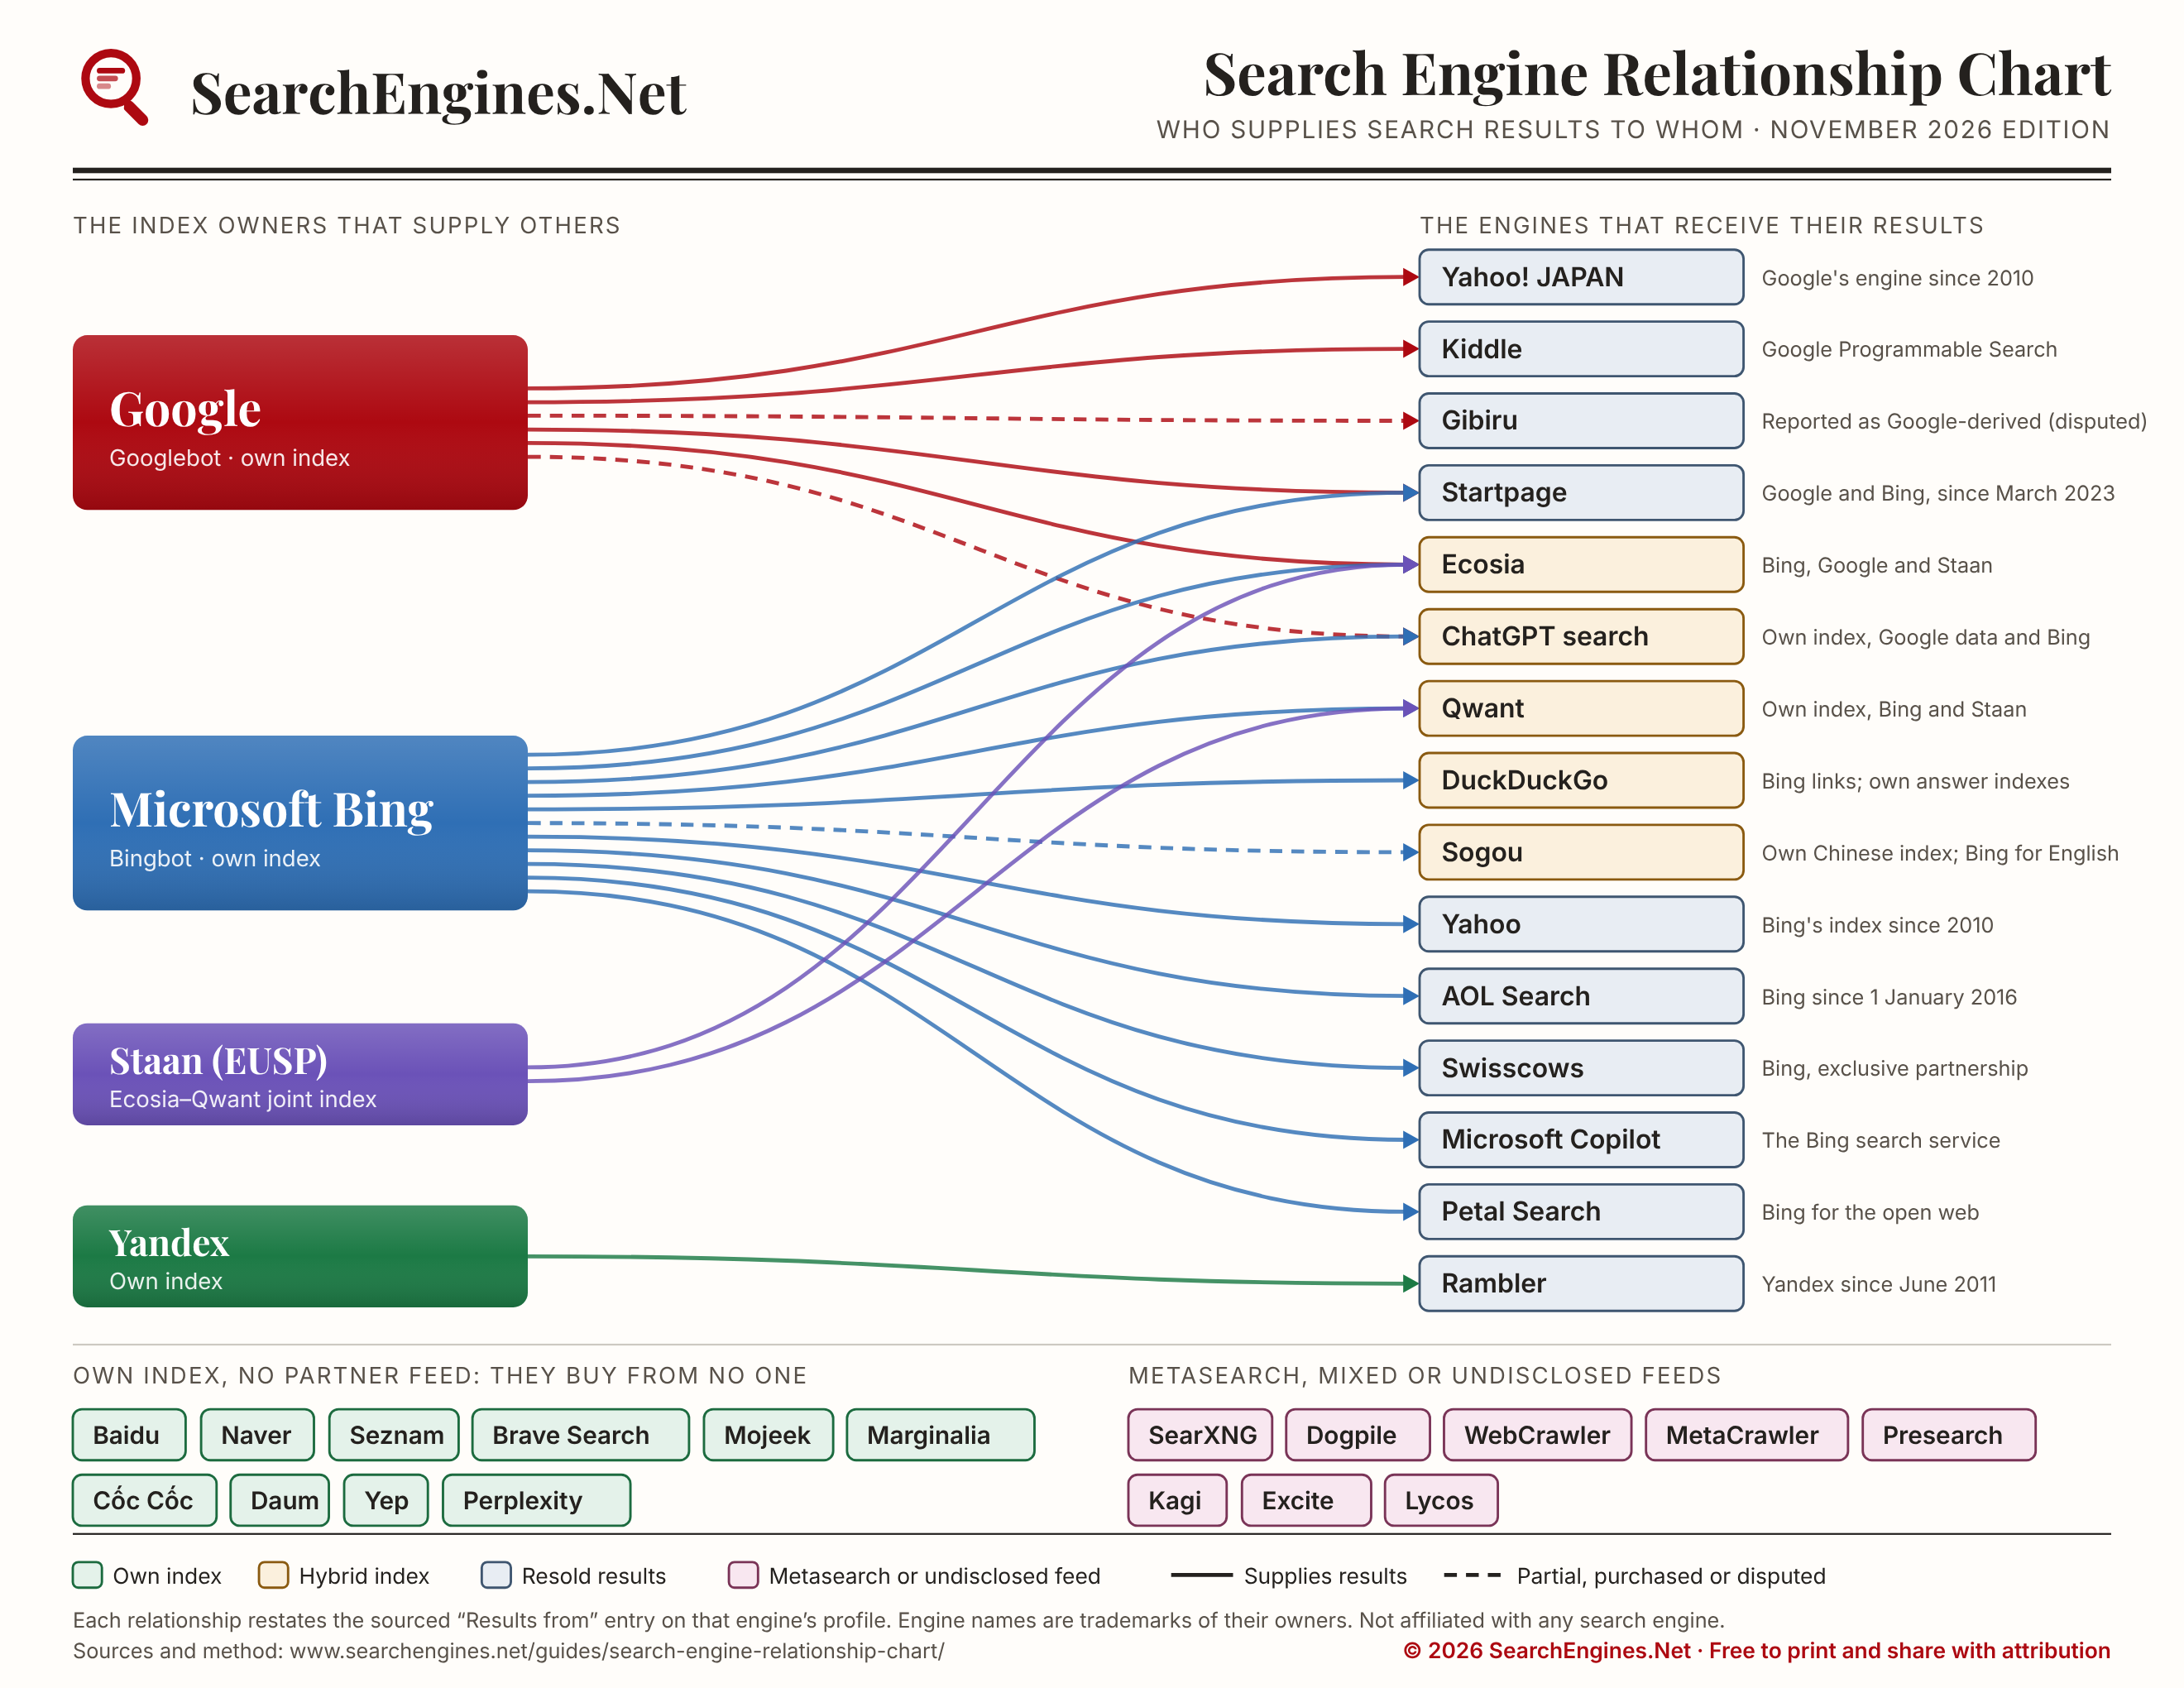
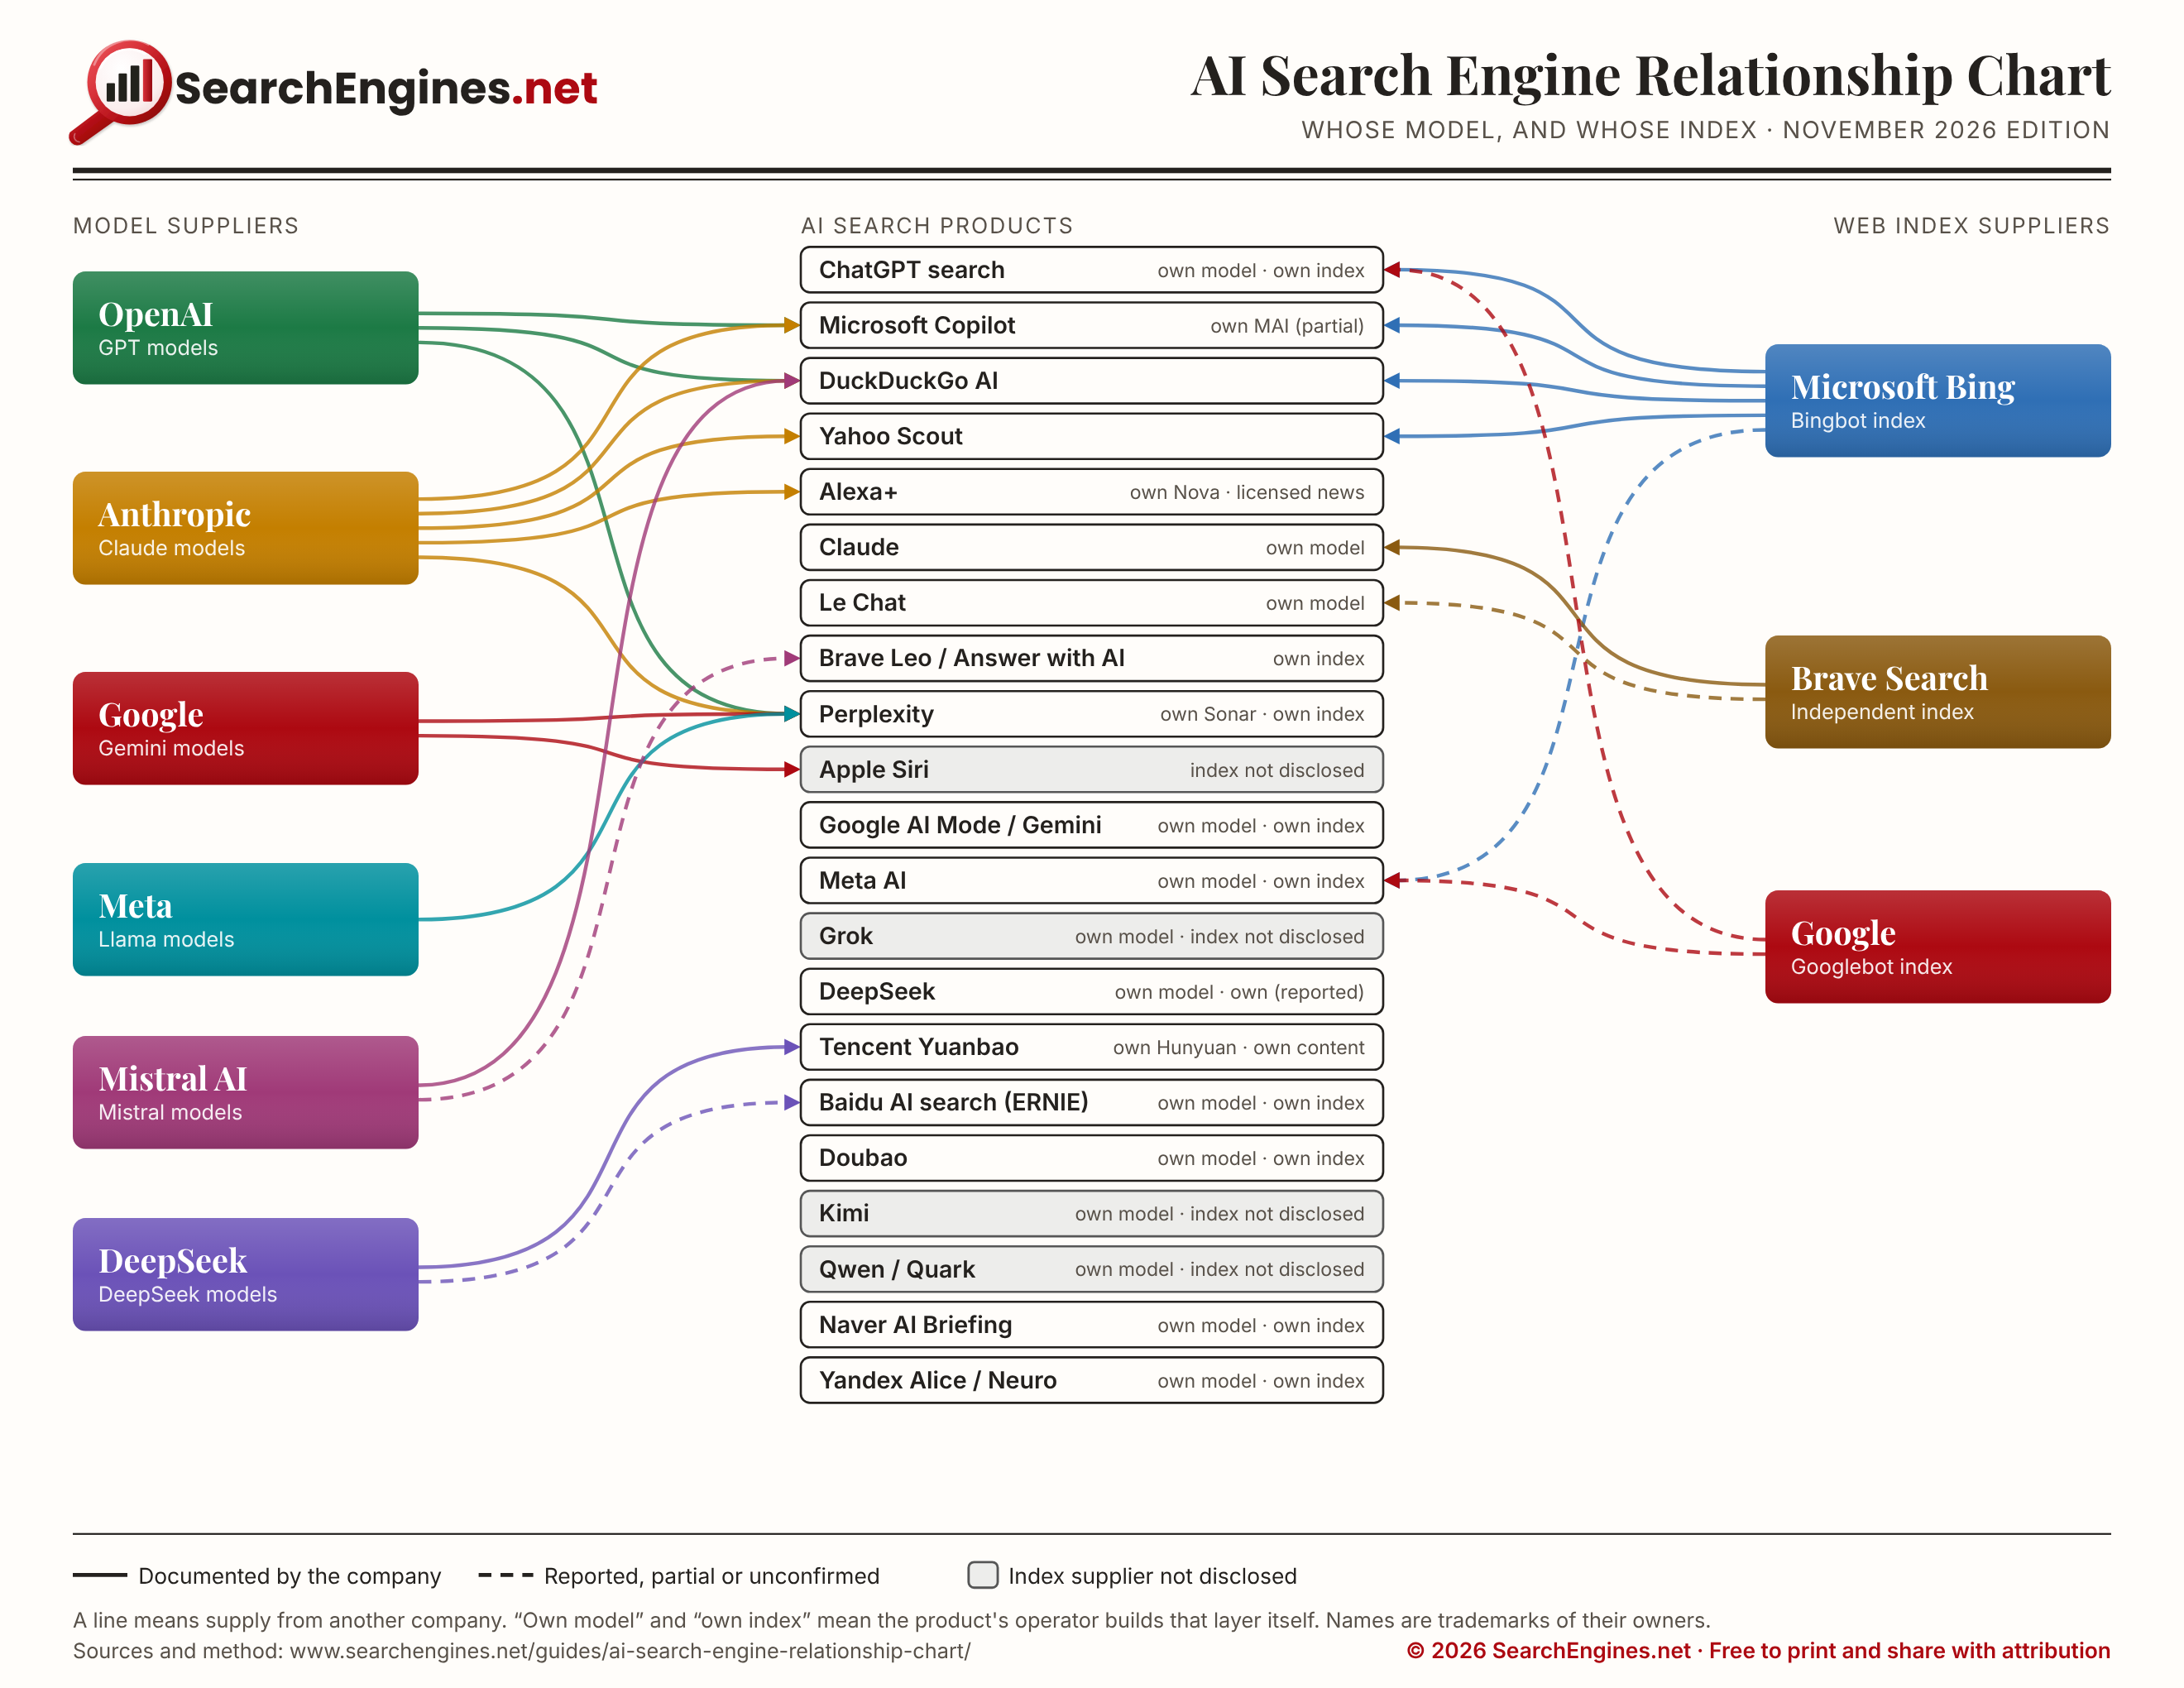
A search engine relationship chart shows which search engines find their own results and which ones receive them from another company. SearchEngines.net publishes two: one for traditional search engines and one for AI search products. Both are single pages, both carry their edition date, and both are free to print and share.
Search Engine Relationship Chart
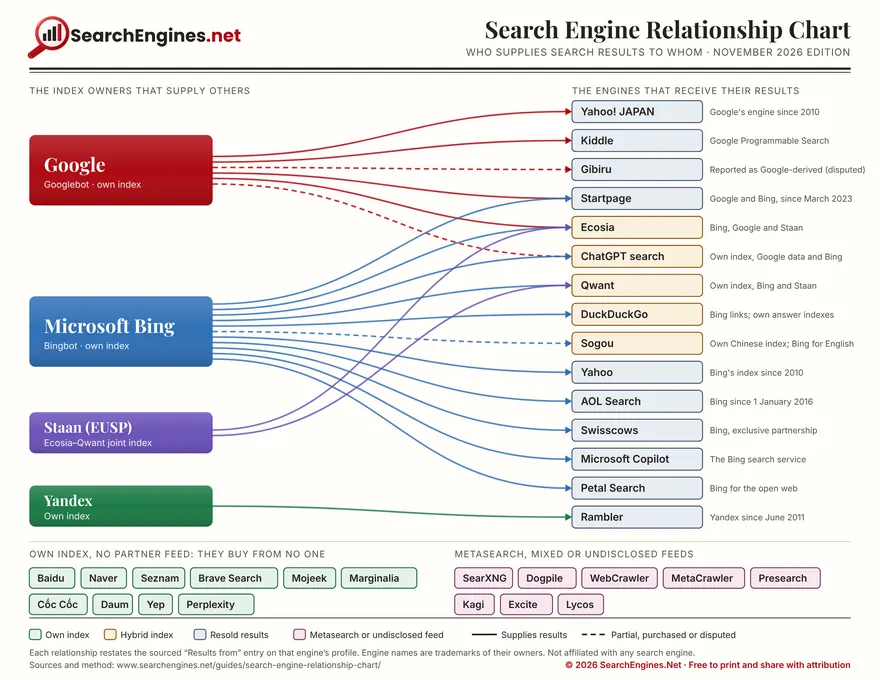
The search engine chart covers 37 engines. Four index owners, Google, Microsoft Bing, Yandex and the European index Staan, supply web results to fifteen other engines, and Bing alone supplies eleven of them. Ten engines buy from no one, and eight more are metasearch engines or portals with mixed or undisclosed feeds. Each line restates a sourced fact from that engine's profile. The full explanation, the table of every relationship and the method are on the search engine relationship chart page.
AI Search Engine Relationship Chart
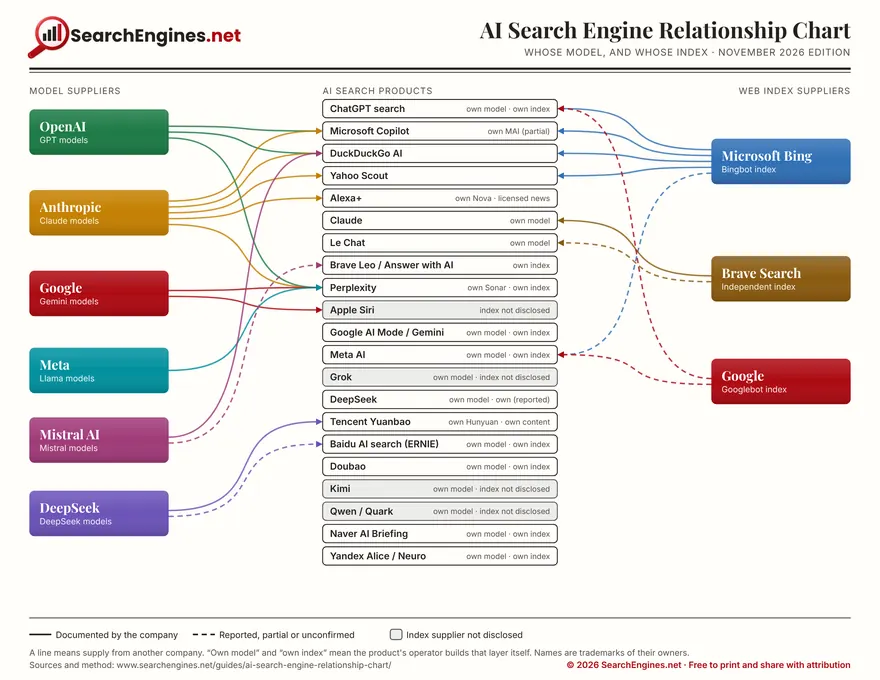
The AI chart covers 21 AI search products worldwide and adds a second dimension, because an AI product needs a language model as well as a web index. Six model makers appear on the left, three index owners on the right, and the products sit between them. Solid lines are documented by the company concerned; dashed lines are reported; products whose index source is not disclosed are marked as such. The full explanation is on the AI search engine relationship chart page, and four companion charts covering grounding, the full stack, crawlers and content licensing are on the AI search charts hub.
Which chart answers which question
| Question | Chart to use | What it covers |
|---|---|---|
| Whose results does Yahoo, DuckDuckGo or Startpage show? | Search Engine Relationship Chart | 37 engines; one relationship, the web index |
| Which engines crawl the web themselves? | Search Engine Relationship Chart | Ten engines that take no partner feed |
| Whose model and whose index does an AI assistant use? | AI Search Engine Relationship Chart | 21 products; two relationships, model and index |
| Which AI companies do not say where their web results come from? | AI Search Engine Relationship Chart | Products marked as not disclosed |
The two are designed to be read together. A market-share table counts brands; these diagrams count suppliers, and the number of suppliers is far smaller than the number of brands. Yahoo, for example, appears on both: its web links come from Microsoft Bing, and its Scout assistant pairs Bing with a model from Anthropic.
Download the charts
Search Engine Relationship Chart
- Search Engine Relationship Chart, PDF: one page, US Letter landscape, vector, with fonts embedded.
- Search Engine Relationship Chart, PNG: 2,640 by 2,040 pixels.
AI Search Engine Relationship Chart
- AI Search Engine Relationship Chart, PDF: one page, US Letter landscape, vector, with fonts embedded.
- AI Search Engine Relationship Chart, PNG: 2,640 by 2,040 pixels.
Both PDFs also print cleanly on A4. The charts may be printed, shared and reproduced without charge, provided the SearchEngines.net attribution and the edition date remain visible. These are the November 2026 editions, checked on 20 November 2026, and each is reissued when a relationship on it changes.
How to cite or link to the charts
Each diagram carries its edition month in the header, and a citation should include it, because the relationships change. A suitable form is: SearchEngines.net, Search Engine Relationship Chart, November 2026 edition. When linking, point to this page or to the individual chart page, not to the image file, so that readers reach the current edition and the sourcing behind it. The PDF addresses stay the same from one edition to the next; the PNG addresses include the edition and are replaced when a new one is issued.
Corrections are welcome. Every line rests on a cited source, and a supplier relationship that has changed is exactly the kind of error this site wants to hear about.
Frequently asked questions
What is a search engine relationship chart?
A diagram showing which search engines supply results to which. Many well-known search brands do not crawl the web themselves and license results from a company that does, and the chart draws those supply lines.
Are the charts free to use?
Yes. Both charts are free to print, share and reproduce, provided the SearchEngines.net attribution and the edition date on the chart are kept.
What is the difference between the two charts?
The search engine chart shows one relationship: whose web index an engine's results come from. The AI chart shows two, because an AI search product needs a language model as well as a web index, and they often come from different companies.